
PneumoTRACE
Enter the access password to continue.
Incorrect password. Please try again.
Population characteristics
NoteSample Collection Period
Samples were collected from January 03, 2026 to July 04, 2026 (1576 total samples)
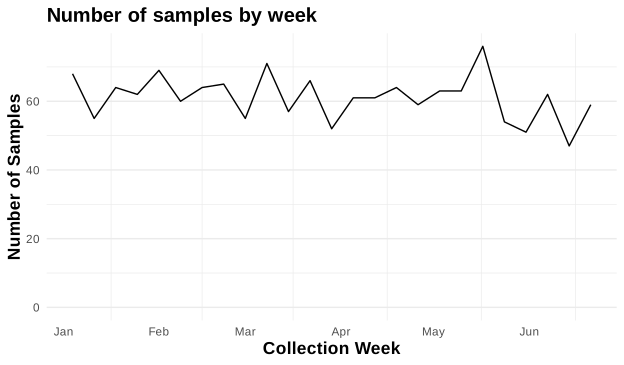
Frequency of samples over time
PneumoTRACE collects and tests samples on an ongoing basis. The figure below shows the samples collected per week that are included in this report.
Age distribution of samples
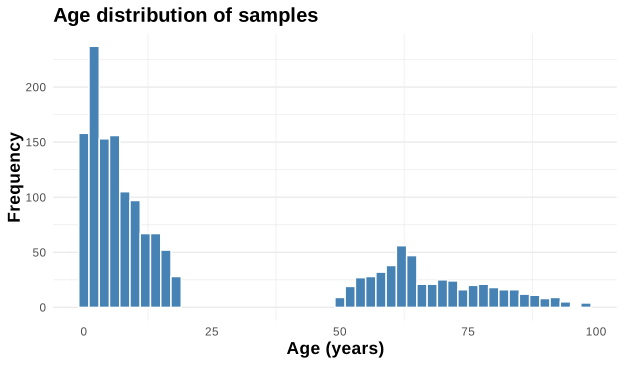
PneumoTRACE focuses on children <18 years and adults 50+ years of age. These age groups were selected to understand serotype patterns among different groups of children, and among adults who have a general recommendation to receive pneumococcal vaccines. We aim to collect similar numbers of samples across the age groups shown in this table.
| Nasopharyngeal samples by age group | |
| Age group | Samples |
|---|---|
| <24m | 250 |
| 2-4y | 235 |
| 5-9y | 293 |
| 10-17y | 256 |
| 50-64y | 273 |
| 65+y | 269 |
| Total | 1,576 |
This graph shows the age distribution of samples collected for our system.
Positivity by age
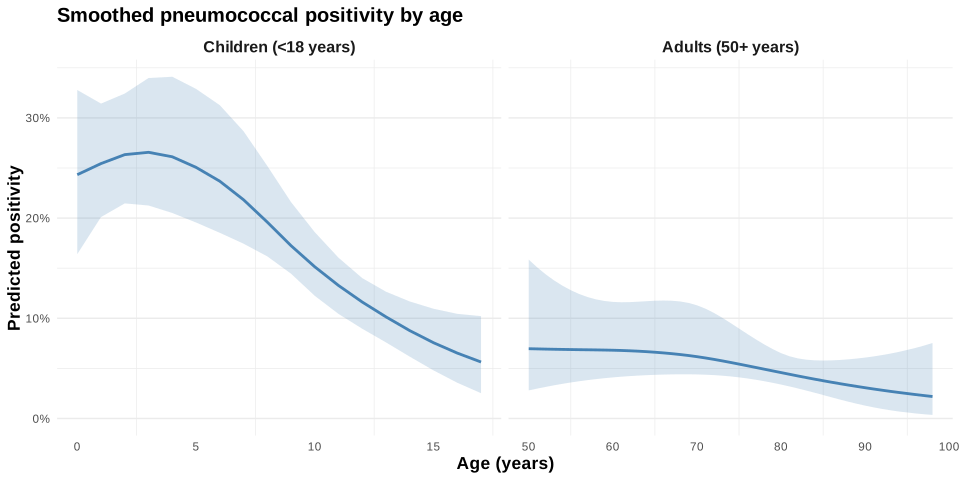
This figure shows the smoothed carriage prevalence (piaB positivity) by age for children (<18 years) and adults (50+ years). This shows carriage prevalence in children peaking around age 3 and then falling sharply after age 5 or 6. In older adults, the prevalence declines in the 70s. These curves are based on relatively little data so far and could change as more data accrue.
Frequency of samples by race ethnicity
Coming soon!
Frequency of samples by PCV history
Coming soon!
Frequency of samples by population density of the ZIP of residence
Coming soon!
Frequency of samples by time since immunization
Coming soon!
Frequency of samples by reason for the visit
Coming soon!