| Pneumococcal (piaB) positivity by age group | |||
| Age group | Samples | Positive | % positive |
|---|---|---|---|
| <24m | 250 | 53 | 21.2% |
| 2-4y | 235 | 74 | 31.5% |
| 5-9y | 293 | 66 | 22.5% |
| 10-17y | 256 | 23 | 9.0% |
| 50-64y | 273 | 17 | 6.2% |
| 65+y | 269 | 14 | 5.2% |

PneumoTRACE
Enter the access password to continue.
Incorrect password. Please try again.
Pneumococcal detection in carriage
NoteSample Collection Period
Samples were collected from January 03, 2026 to July 04, 2026 (1576 total samples)
Pneumococcal carriage prevalence by age
Carriage prevalence tends to decline sharply with older age. This can be seen here, with a sharp dropoff in prevalence between the 5-9 and 10-17 year olds. The prevalence in older adults is even lower. This is in line with previous work from our group, which found low carriage rates in older adults, unless they have regular contact with young children.
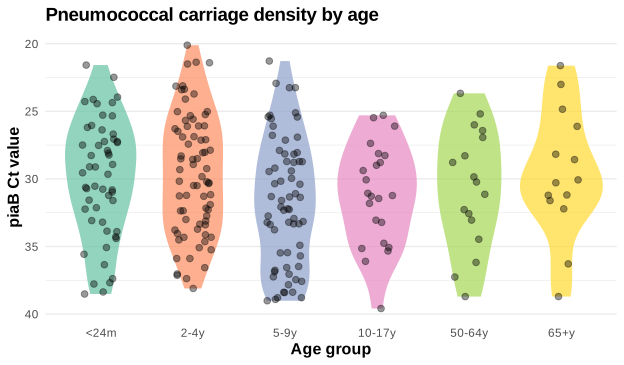
Carriage density by age
These plots show a wide range of carriage densities within each age group. There are more samples with high concentrations in young children.
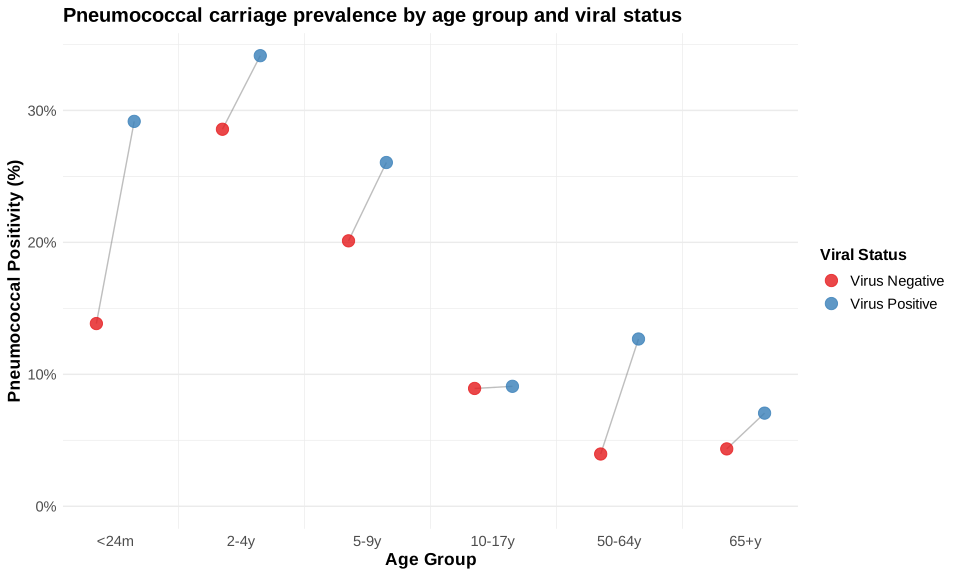
Pneumococcal positivity by viral detection
Not unexpectedly, pneumococcal positivity is substantially higher in individuals with a detectable virus. this is seens across most age groups
| Pneumococcal (piaB) positivity by age group and viral status | ||||||
| Age Group |
Virus Negative
|
Virus Positive
|
||||
|---|---|---|---|---|---|---|
| Samples | Positive | % Positive | Samples | Positive | % Positive | |
| <24m | 130 | 18 | 13.8% | 120 | 35 | 29.2% |
| 2-4y | 112 | 32 | 28.6% | 123 | 42 | 34.1% |
| 5-9y | 174 | 35 | 20.1% | 119 | 31 | 26.1% |
| 10-17y | 168 | 15 | 8.9% | 88 | 8 | 9.1% |
| 50-64y | 202 | 8 | 4.0% | 71 | 9 | 12.7% |
| 65+y | 184 | 8 | 4.3% | 85 | 6 | 7.1% |
Pneumococcal carriage detection by virus category and age group
We can see some differences in pneumococcal positivity associated with specific viruses. This could just be due to the different age distributions of different viruses (e.g., more RSV in young kids, where pneumococcal prevalence is also higher)
| Pneumococcal (piaB) positivity by virus category | |||
| Virus Category | Samples | PiaB Positive | % piaB positive |
|---|---|---|---|
| Negative | 970 | 116 | 12.0% |
| Other | 20 | 7 | 35.0% |
| RSV | 90 | 30 | 33.3% |
| Influenza | 180 | 42 | 23.3% |
| Rhinovirus | 175 | 32 | 18.3% |
| COVID | 48 | 7 | 14.6% |
| hMPV | 48 | 7 | 14.6% |
| Coronavirus | 43 | 6 | 14.0% |
| Parainfluenza | 2 | 0 | 0.0% |
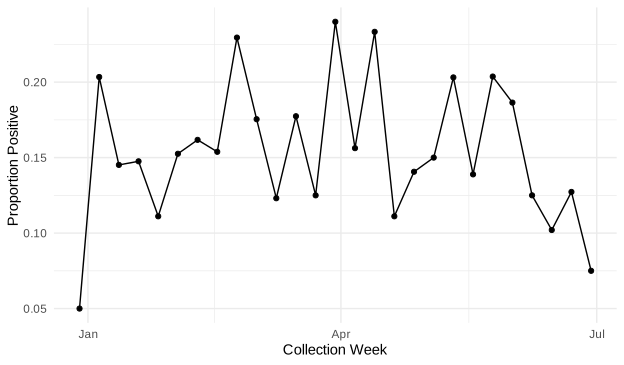
Carriage positivity over time
During the study period, the pneumococcal positiviy rate was fairly consistent.
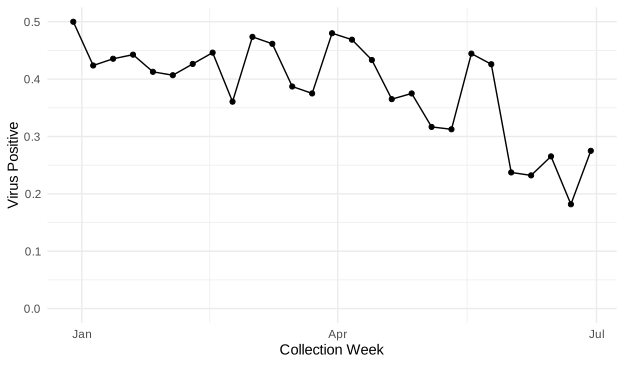
Viral positivity over time
Viral positivity declined in samples collected in late-May through June.
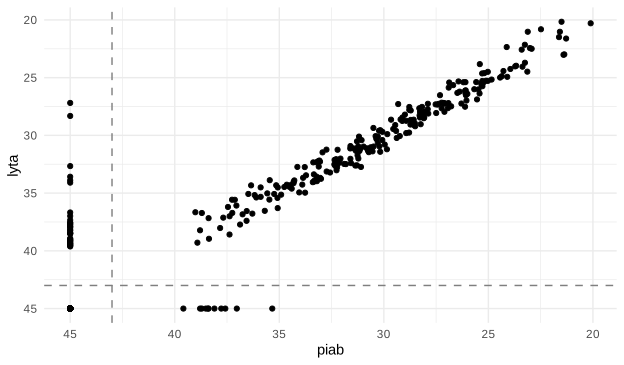
Assay Quality control: Agreement between LytA vs piaB Ct values
This shows strong agreement between the two targets. piaB is generally a more specific indicator of pneumocococcal positivity-encapsulated pneumococci are always piab+. Samples that are lytA+ and piaB- could either be non-typeable pneumococci or other species of Streptococci. The two gene targets do differ in sensitivity however, so particularly for samples with lower concentrations (e.g., Ct>35), one assay might show positivity vs the other.
Positivity by race ethnicity
Coming soon!
Positivity by PCV history
Coming soon!
Positivity by population density of the ZIP of residence
Coming soon!
Positivity by time since immunization
Coming soon!
Positivity by reason for the visit
Coming soon!
Download the data
Reminder that data should not be disseminated except as laid out in the subscription agreement