viewof topN = Inputs.range([3, 20], {
  step: 1, value: 10, label: "Serotypes per age group", width: 240
})

viewof yearValue = Scrubber(raceYears, {
  delay: 1100, autoplay: false, loop: true,
  initial: raceYears.length - 1,
  format: d => `${d}  ${d > endTraining ? "(forecast)" : "(observed)"}`
})

raceYear = yearValue
PneumoTRACE
Enter the access password to continue.
Incorrect password. Please try again.
Serotype-specific nowcasts
Nowcasts of the serotype distributions in IPD
These plots explore the evolution of serotype-specific IPD in the United States, including both reported data from the ABCs system (through the most recently reported year) and short-term forecasts (“nowcasts”) for the most recent years. We make two sets of nowcast predictions: one based on a time series model fit to the reported IPD cases through the most recent available year, and a second based on our carriage data combined with a statistical model that generates projections of IPD incidence (see Methods for details). Combined, these two approaches provide a complementary projection of the current distribution of serotypes causing IPD.
As of now, given the small sample size for the carriage data and some minor issues with assays specificity, we would recommend treating the nowcasts based on the IPD data as the most reliable source, with the nowcasts based on carriage data as supplementary information. For future reports, we are working to synthesize these two sources into a single nowcast.
Serotype distribution by age group
Two independent approaches are used to rank serotypes: a time series model fit to reported IPD cases, and a model based on carriage detection combined with published invasiveness estimates (see Methods for details). Use the tabs below to switch between them.
These first plots show the observed or predicted frequency of serotypes causing IPD across the CDC/ABCs sites. The reported CDC data lags by 2-3 years, so we use projections based on time series models to generate the distributions for recent years. For each age group, serotypes are ranked by their observed or predicted IPD incidence (cases per 100,000) and drawn in descending order on a natural-log x-axis, which spreads out the rare serotypes so they can be distinguished. Press Play (or drag the slider) to step through the years. Years up to and including the end of training show the observed incidence as solid bars; later years show the forecast distribution. Each serotype keeps the same colour across every year and age group, so you can follow it as it rises or falls through the ranks. The carriage-based nowcasts are currently based on very small numbers and will become better calibrated as more data accrue
PCV coverage of IPD by age group
The table shows, for the year selected above, the percentage of all IPD cases in each age group that are caused by serotypes included in each PCV formulation. Percentages use the same observed/forecast IPD counts (and the same year) as the race plots above. We assume that 15B and 15C are interchangeable. For forecast years, values are shown as the median with a 95% uncertainty interval, computed across posterior predictive draws.
This ranking is based on a model that combines serotypes detected in carriage samples with published serotype-specific invasiveness estimates. Carriage prevalence and invasiveness are each sampled to propagate uncertainty, and the resulting predicted IPD counts are calibrated to the total observed IPD burden in children under 5. Unlike the IPD time-series ranking, this is a single national ranking . The shaded area show the predicted number of IPD cases attributable to each serotype with uncertainty (median, with 95% interval).
Serotype-specific IPD time series
Use the controls below to choose a serotype, switch between incidence (per 100,000) and the proportion of IPD, and restrict the range of years shown. The dashed line marks the end of the training period; years to its right are nowcast/forecast. Observed data come from the CDC’s ABCs surveillance, the ‘nowcasts’ come from a custom time series model.
Comparison of predictions based on carriage and IPD
This plot compares, for each serotype, the predicted IPD case count from the time-series nowcast (x-axis, restricted to the national <5 years age band) against the predicted IPD case count from the carriage-based model (y-axis), both for the most recent year with a carriage-based prediction. A serotype predicted by only one of the two approaches is plotted with the other value assumed to be 0 (shown pinned to the axis floor). Points on the dashed 1:1 line indicate agreement between the two independent approaches. Horizontal and vertical bars show the 95% interval for each estimate; hover over a point for details.
Download the data
Reminder that data should not be disseminated except as laid out in the subscription agreement
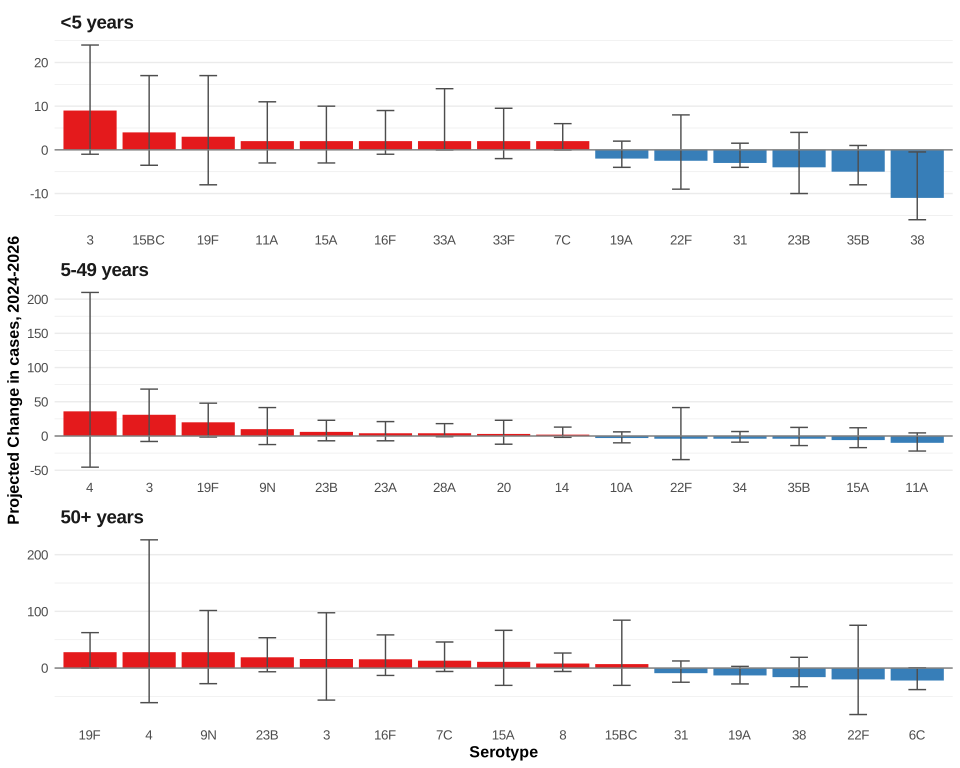
Change in IPD cases, last observed year to last forecast year
This figure shows the change in the number of IPD cases for each serotype between the last observed year (2024, reported data) and the last forecast year (2026, median of the predictive distribution). Error bars reflect the 95% uncertainty interval of the forecast. Positive values indicate a predicted increase and negative bars a predicted decrease. Each age group has its own scale.