| Serotype distribution in children <5y | ||
| Serotype | N | Proportion of serotyped isolates |
|---|---|---|
| 23B | 17 | 16.8% |
| 35B | 14 | 13.9% |
| 23A | 7 | 6.9% |
| (43*) | 7 | 6.9% |
| 31 | 6 | 5.9% |
| 35F | 6 | 5.9% |
| 19F | 5 | 5.0% |
| 21 | 5 | 5.0% |
| 6C | 4 | 4.0% |
| 7C | 4 | 4.0% |
| 11D | 3 | 3.0% |
| 15BC | 3 | 3.0% |
| 45 | 3 | 3.0% |
| 11A | 2 | 2.0% |
| 11E | 2 | 2.0% |
| 35D | 2 | 2.0% |
| 5 | 2 | 2.0% |
| 15A | 1 | 1.0% |
| 16A | 1 | 1.0% |
| 22F | 1 | 1.0% |
| 23F | 1 | 1.0% |
| 33H | 1 | 1.0% |
| 34 | 1 | 1.0% |
| 7D | 1 | 1.0% |
| 9A | 1 | 1.0% |
| 9V | 1 | 1.0% |
| *Serotype 43 is likely a lab artifact | ||

PneumoTRACE
Enter the access password to continue.
Incorrect password. Please try again.
Serotype patterns in carriage
Carriage data
This page shows the serotype distribution by individual characteristics, including demographics and vaccine history
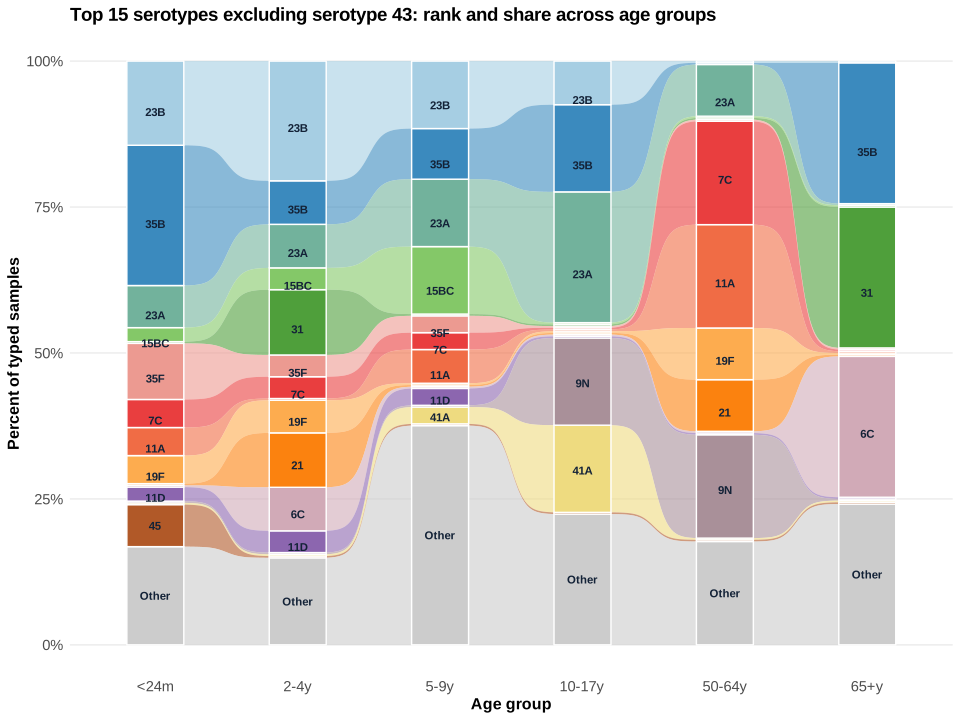
Serotype frequency by age group
This shows the proportion of carriage episodes in each age group with each serotype. Only samples with a valid serotype call are included in these totals.
The most important serotypes in children <5y, the most commonly detected serotypes were 23B, 35B,23A,31,35F, 19F, 21, 6C, 7C.
This list largely agrees with recently presented conference findings from Rochester (top serotypes, in order were 35B, 23B, 23A, 19F, 35F, 11A, 15C, 6C) and Boston (35B, 23A, 23B, 35F,21, 15B, 15A, 11A, 22F). Note that we detect a lot of serotype 43, but we are confident that serotype 43 is an artifact of the sequencing assay and are working on a solution to clean it up.
Important note: these serotype frequencies should be considered provisional. We are still working on improving the sequencing assay, and some serotypes, particularly within serogroups, can be difficult to resolve. We will be working to improve on the sequencing assays to improve both specificity and sensitivity.
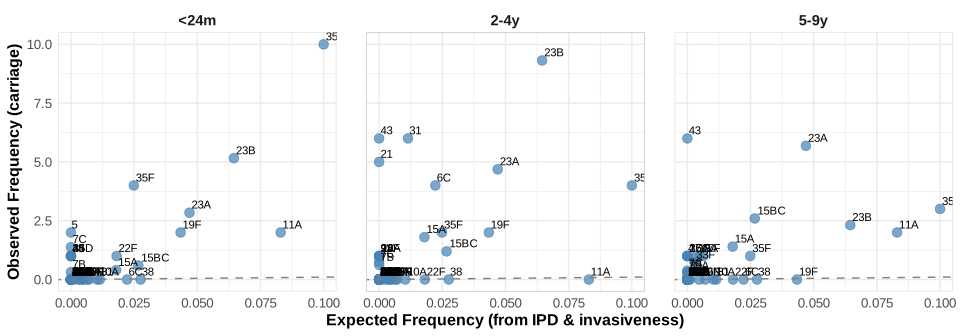
Observed vs. expected carriage frequency
This plot compares the observed frequency of serotypes in carriage samples to the frequency we would expect based on 2024 IPD surveillance data and published invasiveness estimates. Serotypes above the diagonal are more common in carriage than expected, while those below are less common. This comparison helps identify (1) if there are adjustments that need to be made to the sequencing assay (e.g., it is unlikely that the serotype 43 carriage is a real signal) or (2) if there are notable changes. These comparisons will become more valuable over time as we are able to distinguish assay issues from true signal.
Serotype frequency by presence of a virus
Serotype distribution among pneumococcal-positive samples, split by whether a virus was also detected (combined across age groups). Positive samples that did not receive a confident serotype call are shown as their own row rather than excluded.
| Serotype distribution among pneumococcal-positive samples, by viral status | ||||
| Serotype |
Virus Negative
|
Virus Positive
|
||
|---|---|---|---|---|
| N | % of positives | N | % of positives | |
| 43 | 11 | 1.1% | 12 | 2.0% |
| 23B | 9 | 0.9% | 13 | 2.1% |
| 35B | 9 | 0.9% | 11 | 1.8% |
| 23A | 7 | 0.7% | 8 | 1.3% |
| 15BC | 2 | 0.2% | 5 | 0.8% |
| 31 | 3 | 0.3% | 4 | 0.7% |
| 35F | 1 | 0.1% | 6 | 1.0% |
| 7C | 3 | 0.3% | 4 | 0.7% |
| 11A | 2 | 0.2% | 4 | 0.7% |
| 19F | 1 | 0.1% | 5 | 0.8% |
| Other serotype | 27 | 2.8% | 32 | 5.3% |
| Uncolonized/no call | 895 | 92.3% | 502 | 82.8% |
Serotype frequency by age and immunization history
Coming soon!
Which vaccines did the individual received?
Coming soon!
Serotype frequency by age and population density of the ZIP of residence
Coming soon!
Serotype frequency by age and race/ethnicity
Coming soon!
Serotype frequency by age and reason for the visit
Coming soon!